The median UK salary for full-time employees is £39,039 per year as of April 2025, according to the ONS Annual Survey of Hours and Earnings (ASHE). If you include part-time workers, that figure sits closer to £37,000. These are the most authoritative benchmarks available — and they're the ones to use when comparing your own pay.
The national average, though, masks enormous variation. Where you live, how old you are, and what sector you work in can shift your earnings by £15,000 or more in either direction. This guide breaks down the real numbers across all three dimensions.
Mean vs Median: Which Figure Should You Use?
You'll regularly see two figures quoted when salaries come up: the mean and the median. The mean UK salary is around £42,000–£44,000 — but it's pulled up by a relatively small number of very high earners. The median (the midpoint where half earn more and half earn less) is a far better reflection of what most UK workers actually take home. Throughout this article, we use the median unless stated otherwise.
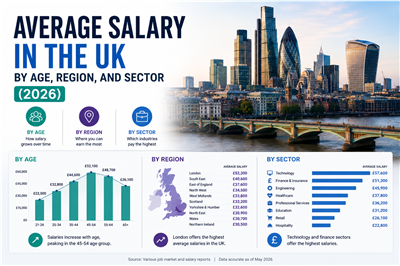
Average UK Salary by Region (2026)
London distorts the national picture considerably. Strip it out, and the gap between the best-paid and least-paid regions is around £16,000 from South East to North East. Here's how median full-time salaries compare across UK regions, based on ONS ASHE 2025 data:
| Region | Median Full-Time Annual Salary |
|---|---|
| London | £48,000 |
| South East | £41,500 |
| East of England | £39,500 |
| Scotland | £36,500 |
| South West | £36,000 |
| West Midlands | £35,500 |
| North West | £35,000 |
| East Midlands | £34,500 |
| Yorkshire & Humber | £34,000 |
| Wales | £33,000 |
| Northern Ireland | £32,500 |
| North East | £32,000 |
London's premium looks compelling — roughly 25% above the national median — but it narrows considerably once you factor in housing costs. Renting a one-bedroom flat in Zone 2 or 3 runs to around £1,800–£2,200 per month in 2026. For roles paying under £45,000, the financial argument for relocating to London is weaker than the headline salary gap suggests. For senior roles at £70,000 and above, London still has a meaningful real-terms advantage.
Cities like Manchester, Leeds, Edinburgh, and Birmingham are increasingly competitive for mid-to-senior roles in technology, financial services, and professional services — often offering salaries close to London rates with substantially lower living costs.
Average UK Salary by Age (2026)
Pay in the UK follows a fairly consistent arc: it rises sharply through your 30s, peaks in your 40s, and edges back slightly after 50. The jump from your 20s to your 30s is the steepest of any decade. Here's how median full-time salaries break down by age group, based on ONS ASHE data:
| Age Group | Median Full-Time Annual Salary |
|---|---|
| 18–21 | £19,500 |
| 22–29 | £29,000 |
| 30–39 | £40,000 |
| 40–49 | £44,500 |
| 50–59 | £43,000 |
| 60+ | £37,500 |
The £11,000 jump between the 22–29 and 30–39 brackets reflects career progression, accumulated experience, and movement into management or specialist roles. If you're in your late 20s and earning at the lower end of your bracket, switching employers is statistically the fastest route to a significant pay rise — internal salary growth rarely keeps pace with what the open market offers.
Average UK Salary by Sector (2026)
What industry you work in has more impact on your salary than almost any other single factor. Finance and technology sit firmly at the top; care work and hospitality occupy the bottom rungs. The gap between the highest and lowest-paying sectors is more than £40,000 at median level. Here's a detailed breakdown drawing on ONS ASHE 2025 data and 2026 recruitment benchmarks:
| Sector | Median Salary | Entry Level | Senior Level |
|---|---|---|---|
| Finance & Banking | £62,000 | £28,000 | £120,000+ |
| Legal Services | £58,000 | £26,000 | £100,000+ |
| Technology & IT | £56,000 | £30,000 | £90,000+ |
| Management Consulting | £54,000 | £28,000 | £100,000+ |
| Engineering | £45,000 | £28,000 | £75,000+ |
| NHS / Healthcare | £38,000 | £25,000 | £65,000+ |
| Construction | £36,000 | £22,000 | £60,000+ |
| Education | £35,000 | £28,000 | £55,000+ |
| Marketing & PR | £34,000 | £23,000 | £65,000+ |
| Retail | £25,000 | £13,000 | £45,000+ |
| Hospitality & Catering | £22,000 | £12,580 | £40,000+ |
| Care & Social Work | £21,000 | £12,580 | £35,000+ |
A few things stand out. Technology has exceptional upside — a senior software engineer or data scientist in London can reach £100,000+ within a decade. Healthcare and education have compressed pay scales that require management progression to break through their respective ceilings. And sectors like care and hospitality, despite consistent labour shortages, continue to pay close to the National Living Wage floor at entry level.
What Do You Actually Take Home?
Gross salary and take-home pay are quite different. The UK personal allowance is £12,570, with income tax at 20% on earnings up to £50,270 and 40% above that. Employee National Insurance runs at 8% between £12,570 and £50,270, then 2% above. Here's what that means in practice for common salary levels:
- £30,000 gross: approximately £24,622 take-home (£2,052/month)
- £37,000 gross (UK median): approximately £29,500 take-home (£2,458/month)
- £50,000 gross: approximately £37,836 take-home (£3,153/month)
- £75,000 gross: approximately £51,100 take-home (£4,258/month)
One quirk worth knowing: earnings between £100,000 and £125,140 attract an effective marginal tax rate of 60%, because the personal allowance is tapered away at £1 for every £2 earned above £100,000. This is one of the less-discussed features of the UK tax system and catches many higher earners off guard.
The Gender Pay Gap
The median gender pay gap for full-time employees stands at 7.5% in 2026 — down from 27% in 1997, but progress has slowed considerably since around 2018. Across all employees including part-time workers, the gap widens to around 14.3%, partly because women make up a higher proportion of the part-time workforce. The gap is nearly closed for workers aged 22–29 but widens sharply after 40, linked to career breaks and the concentration of women in lower-paid sectors. Employers with 250 or more staff are legally required to publish their gender pay gap data annually — this information is publicly available and worth reviewing before accepting a job offer.
The National Living Wage in 2026
The National Living Wage for workers aged 21 and over rose to £12.21 per hour from April 2025 — a 6.7% increase. At full-time hours (37.5 per week), that equates to around £23,860 per year before tax. The rate for workers aged 18–20 is £10.00 per hour, and for 16–17 year olds and first-year apprentices it is £7.55 per hour. These rates are reviewed annually by the Low Pay Commission.
Looking for a better-paid role? Browse our latest job vacancies across the UK — search by region, sector, and salary to find positions that match where you want to be.